The Why: The market didn't match my needs
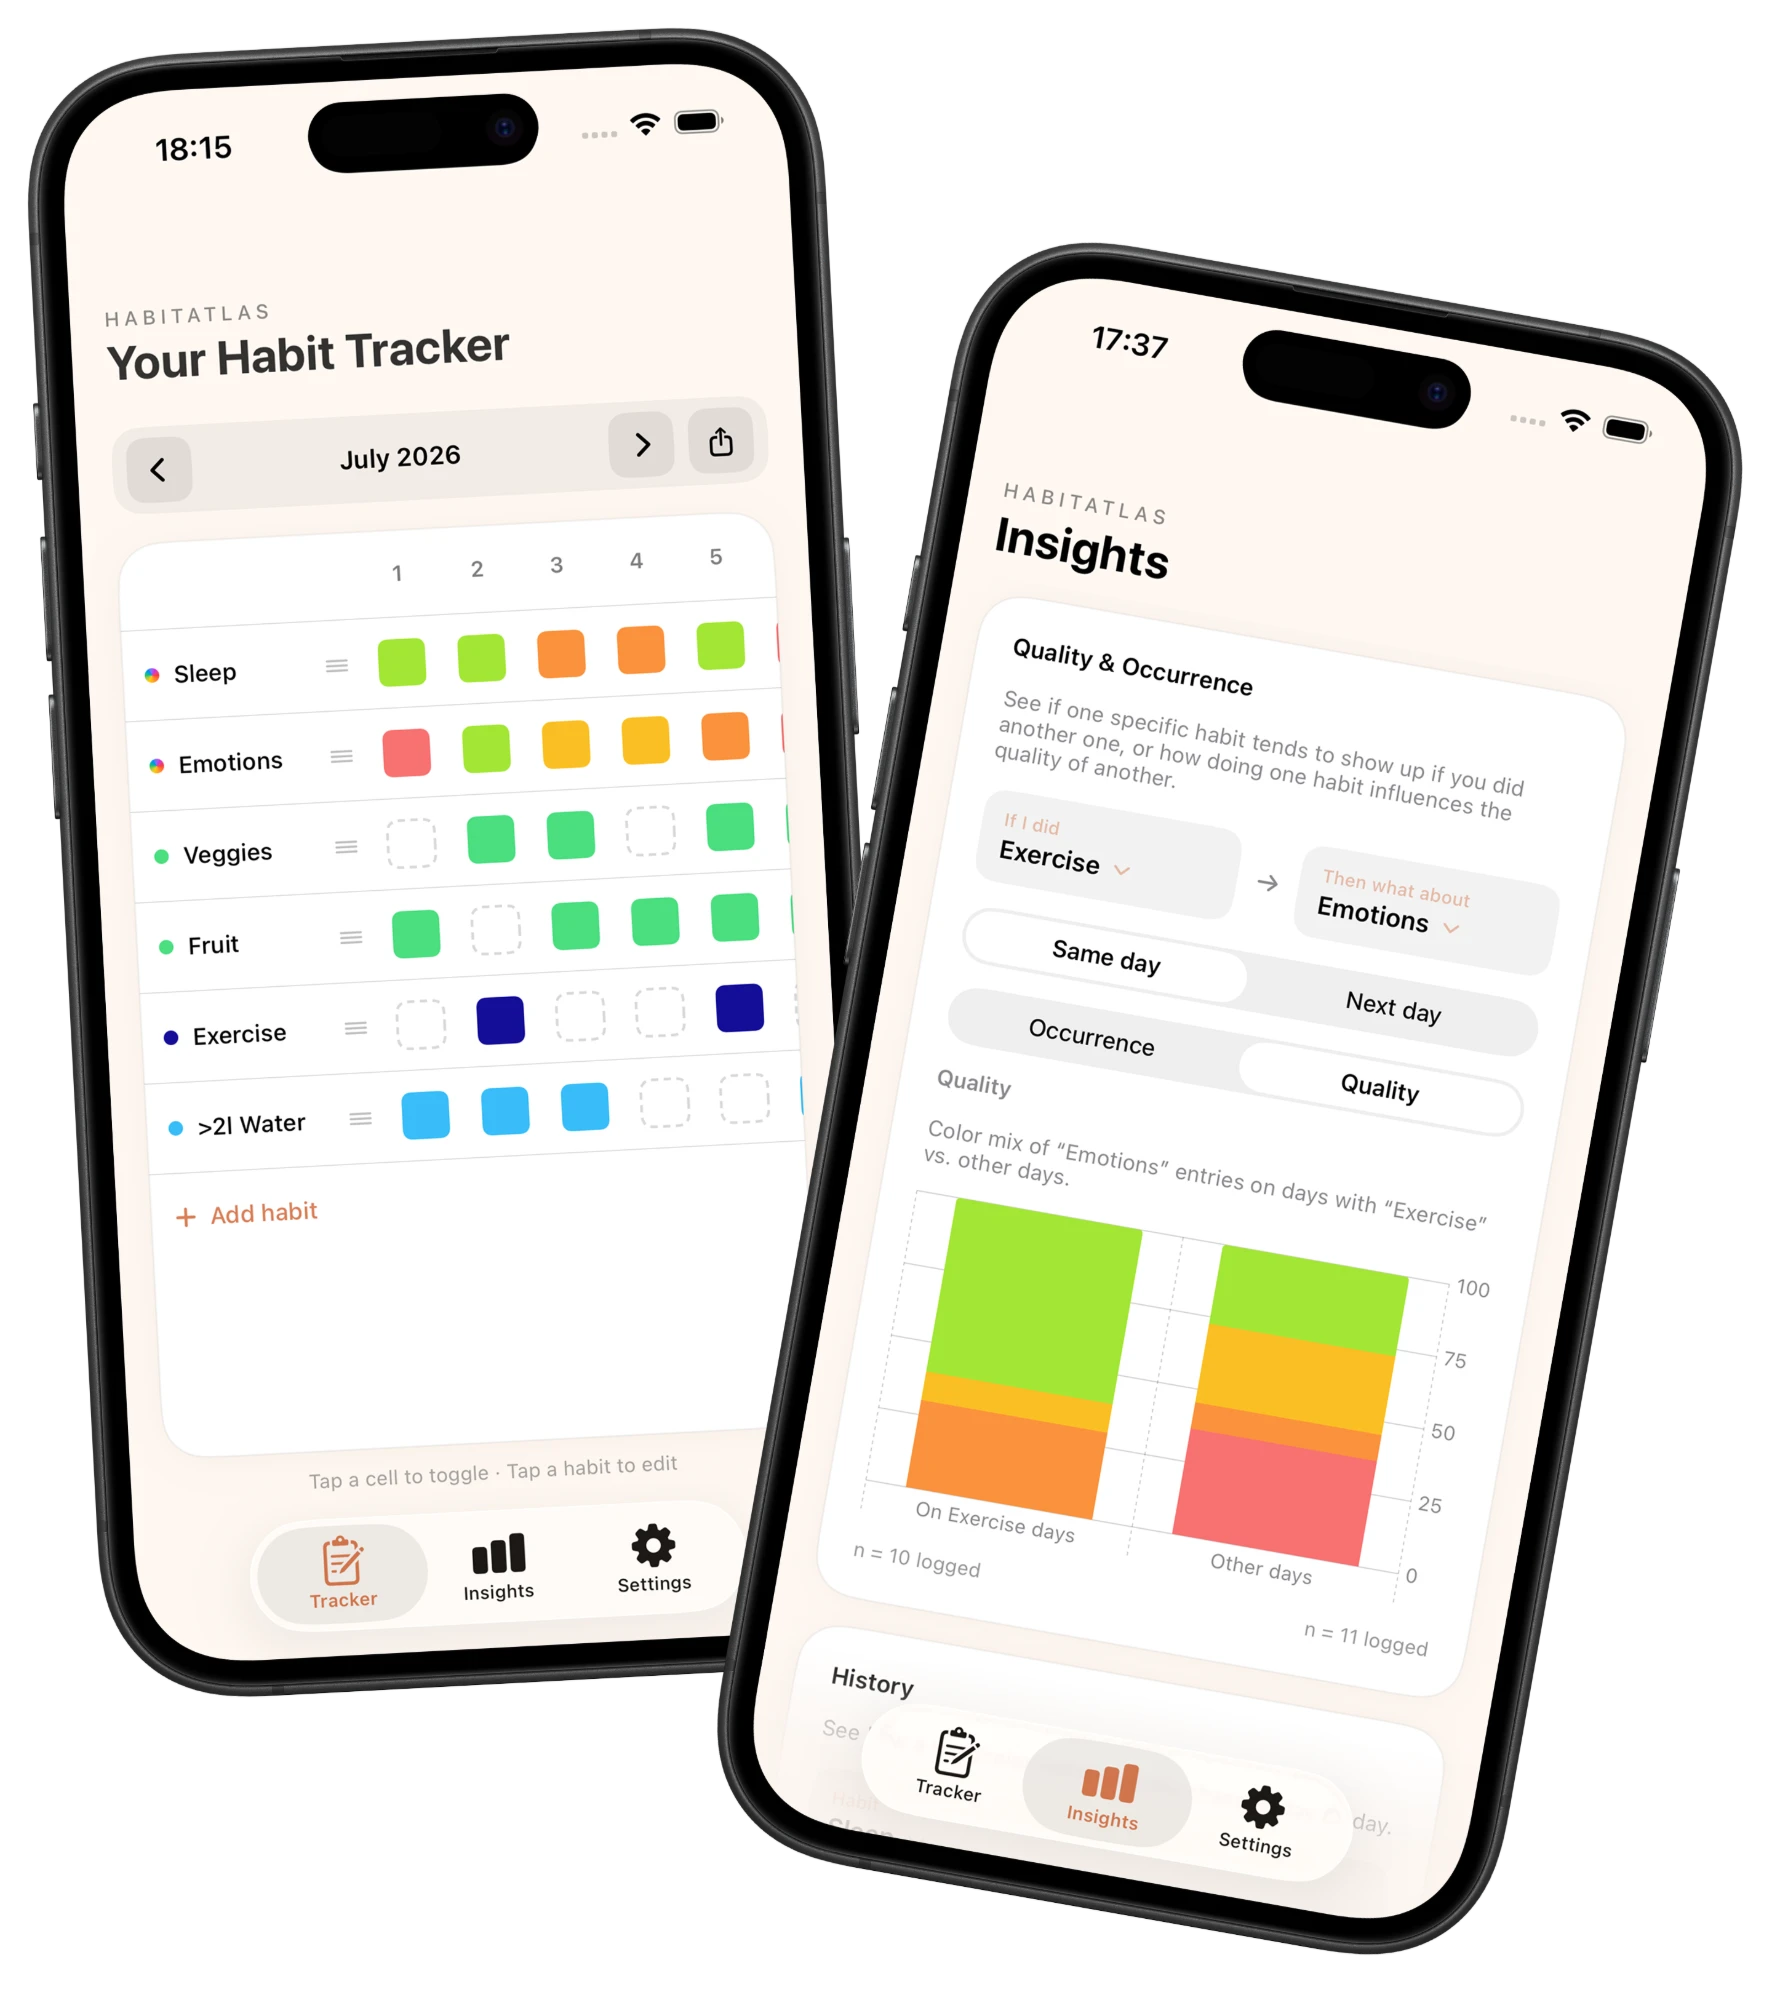
Most habit trackers force you to log duration, frequency, and endless metrics, and that friction is exactly what discouraged me from keeping up with mine. I wanted something minimal: a "did I do it?" binary tracker paired with an optional qualitative scale (like sleep quality), shown in a clean grid I could read at a glance. No tool balanced that simplicity with meaningful correlation insights, so I built it myself.
The Solution: Minimalist Tracking, Meaningful Insights
HabitAtlas is designed to be the bridge between simple daily check-ins and actionable life analytics.
- Binary & qualitative tracking: log a habit with a single tap, plus an optional color-coded scale for things like sleep quality.
- Grid visualization: a lean monthly grid that makes patterns and correlations between habits visible at a glance.
- Correlation engine: cross-reference two habits to see how one affects the other, e.g. how workout consistency tracks against sleep quality, alongside consistency and quality history over time.
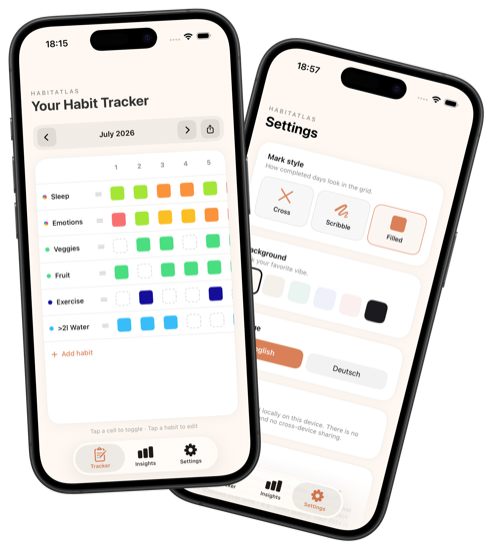
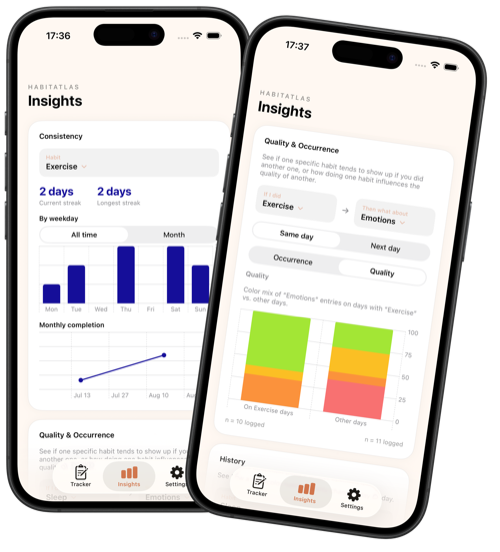
The habit grid and settings, and two of the Insights views.
From Analog Scribbles to MVP: The HabitAtlas Workflow
HabitAtlas started as an analog experiment: I tracked my habits by hand on a 31-column grid drawn on my iPad. The format was right, but manual logging wasn't sustainable. I needed the simplicity of the scribbled grid with the intelligence of an app.
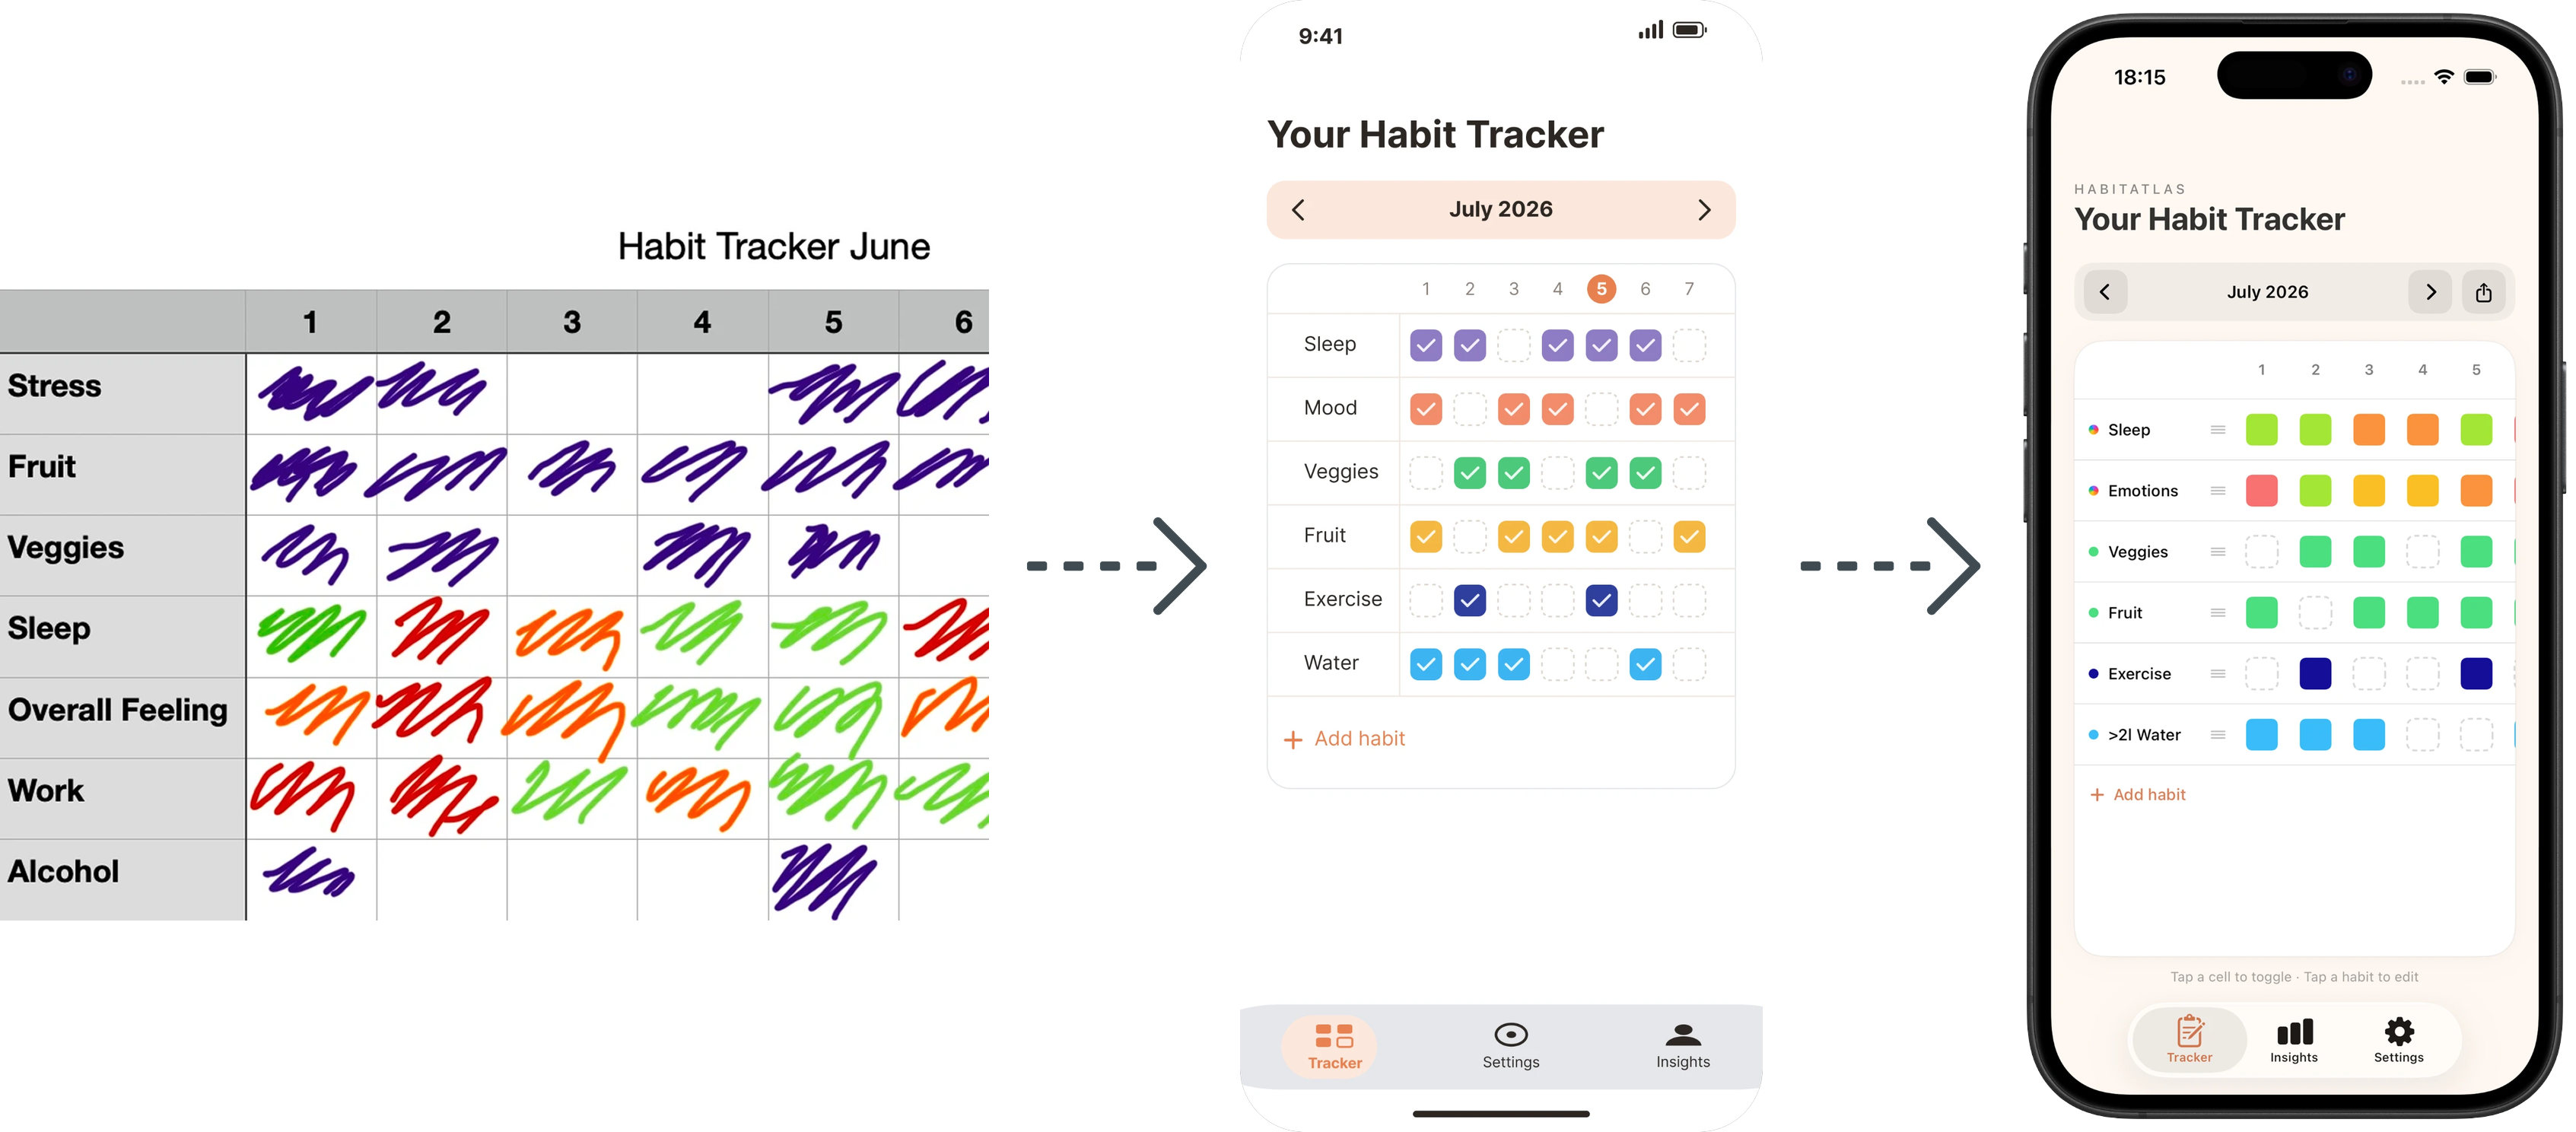
From a hand-drawn habit grid to early Figma wireframes to the live iOS app.
- Analog prototype: two weeks with the hand-drawn grid confirmed I needed only a binary "did I do it?" and a qualitative scale for factors like sleep, not duration or frequency.
- Figma wireframing: I stripped the UI down to a low-friction interface for rapid logging, kept it deliberately simple to clarify what was worth building, then moved into development.
- Code & implementation: I built the app in Swift and Xcode to test directly on my own iPhone, the fastest path from design idea to live testing, with a developer account already set up for App Store release.
Engineering a Low Friction UX
Marking a habit done, unmarking it, and logging the qualitative scale (e.g. sleep quality) are all handled in a single tap. With existing trackers, the friction of juggling multiple gestures is what led me to skip logging and end up with incomplete data.
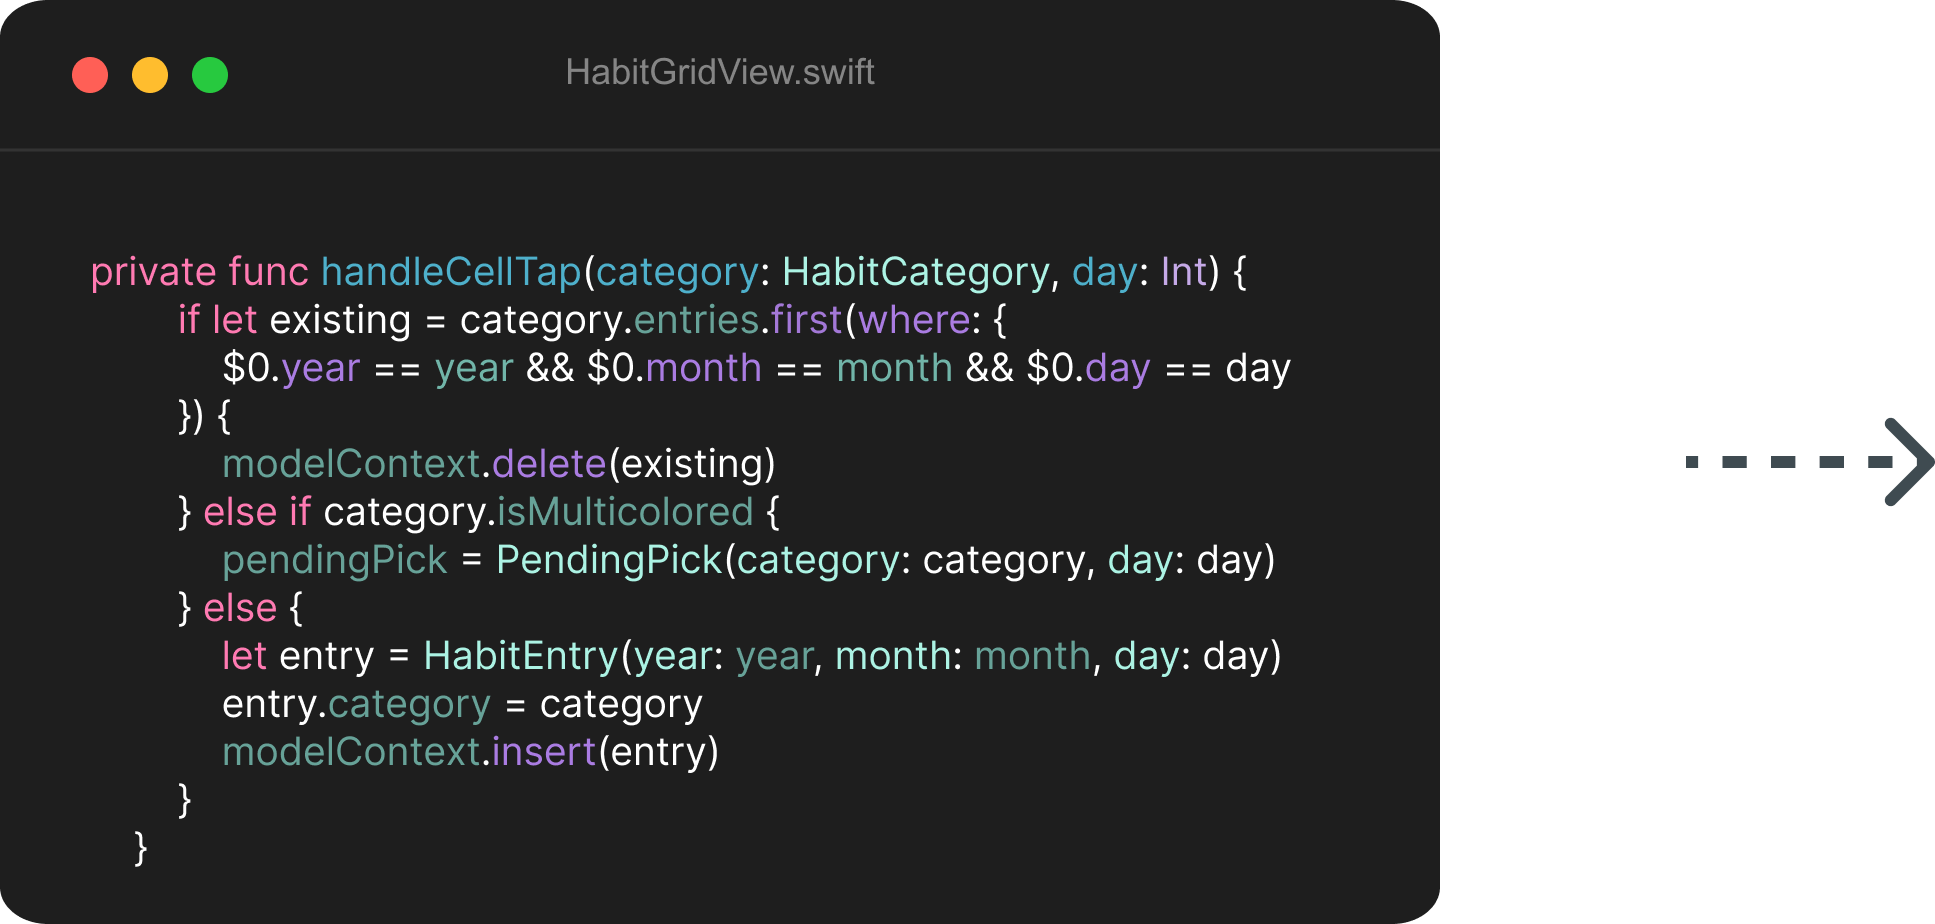
Swift implementation of the single-tap habit log, next to a screen recording of the resulting app.
Personalization: Making the Grid Feel Like Yours
The recurring piece of beta feedback was that people wanted personalization, and everyone's preference differed: calm neutral backgrounds for some, bolder colors for others, and the same split over how a "done" day should look. A settings screen now lets users pick their background scheme and how completed habits are marked, as a cross, a scribble, or a filled square.
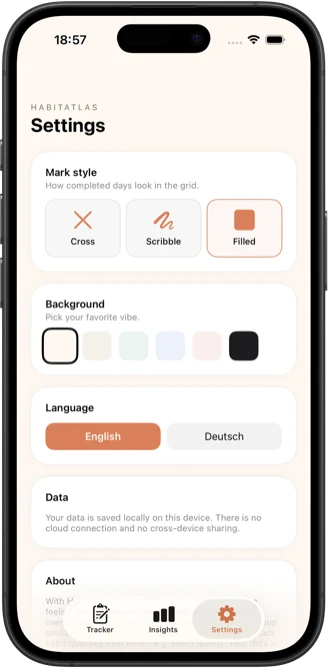
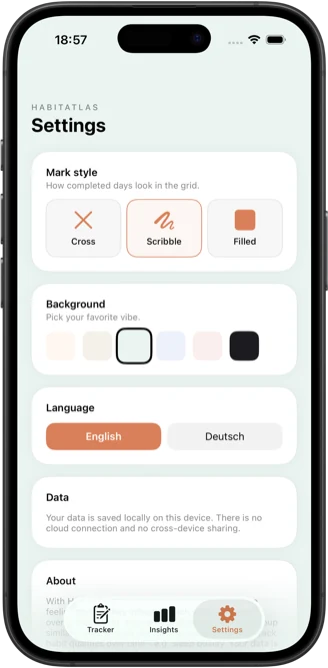
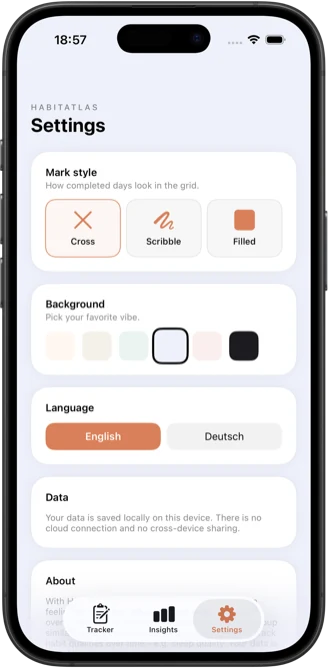
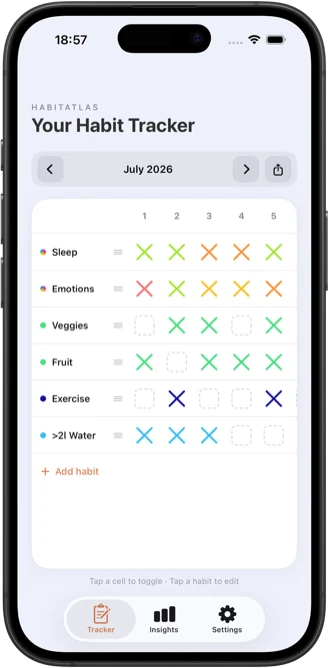
Users can pick their background color scheme and how completed days are marked, from a cross to a scribble to a filled square.
Insights: From Daily Logs to Understandable Patterns
Logging a habit is only half the value. Seeing what it actually means over time is the other half. The Insights tab turns the raw daily grid into three focused views:
- Consistency: Current and longest streaks per habit, a by-weekday breakdown to spot which days a habit tends to slip, and a monthly completion trend to see whether it's improving or declining.
- Quality & Occurrence: A correlation view where you pick two habits and see whether doing one changes how often, or how well, the other happens, comparing "same day" against "next day" effects.
- History: A color-coded monthly calendar for any qualitative habit, so a full month's pattern is visible at a glance.
AI: Translated the questions users should be able to ask into Swift statistics and correlation calculations.Me: Defined the insights, designed how they read, and tested every output against my own tracked data.Statistics and correlation logic aren't my core expertise, so I built the analytical engine with Claude Code, an AI coding agent: I defined what users should be able to ask and see, the agent helped translate that into the Swift calculations, and I tested every output against my own tracked data to make sure the insights held up.
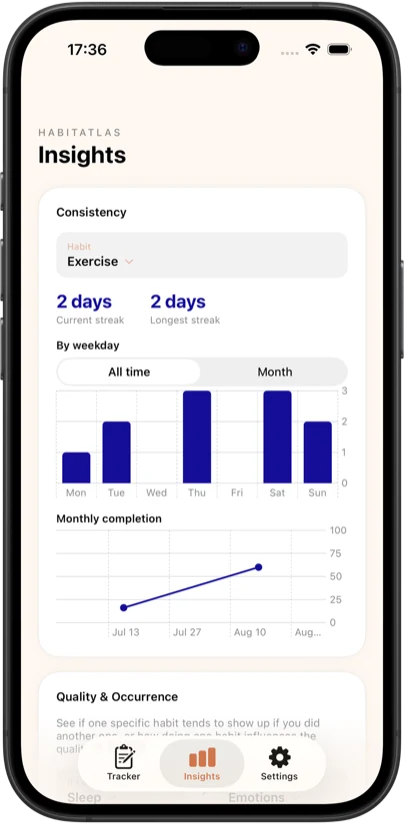
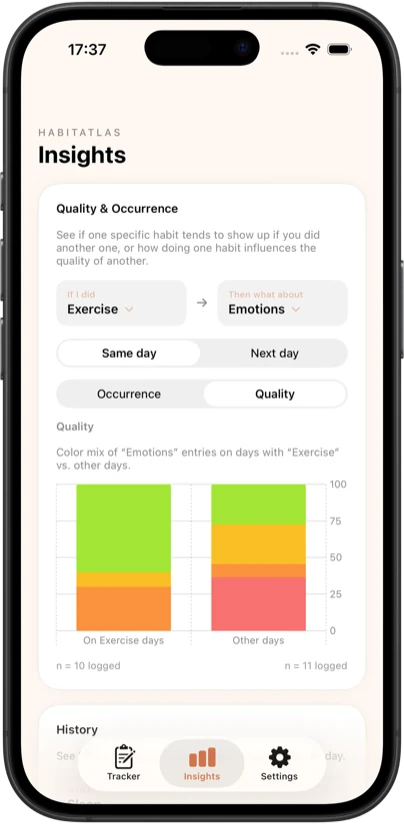
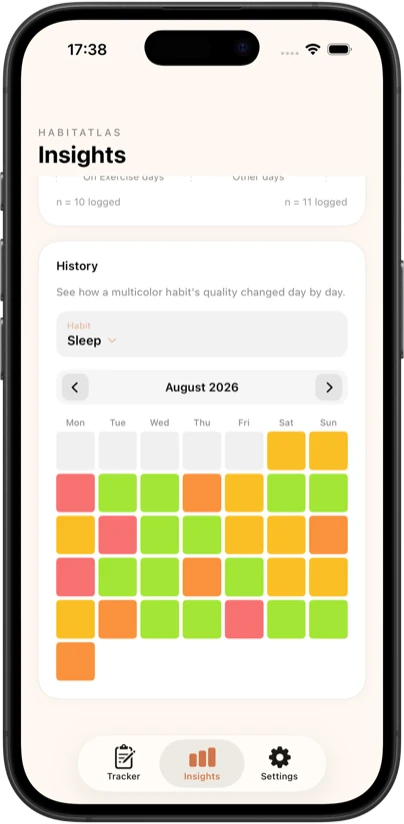
The three Insights views: streaks and trends, cross-habit correlation, and a color-coded monthly history.
Beta Testing: Three Months Before Launch
Before the launch, I used HabitAtlas daily since June 2026, and two beta testers used it since July. Their feedback checked that logging stays as low-friction as I intended, and it led to the personalization settings that shipped with the release.
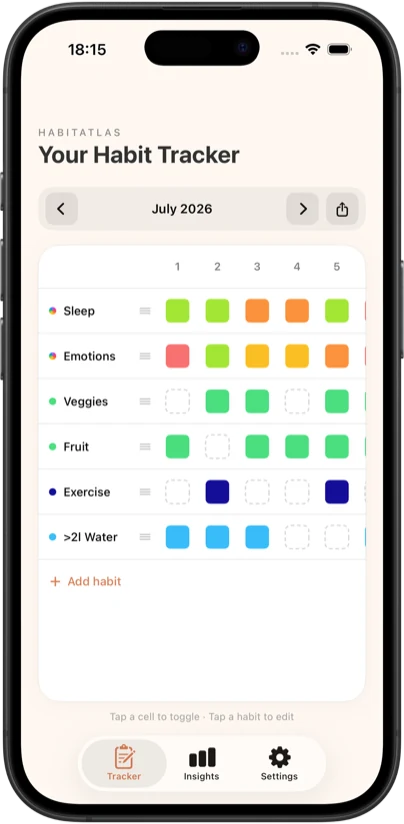
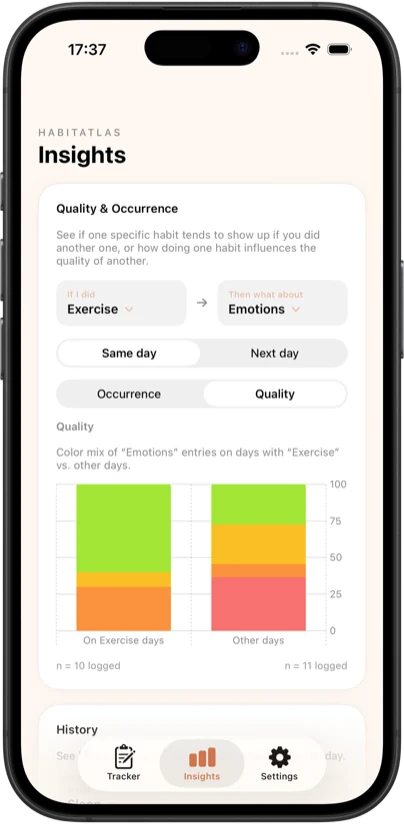
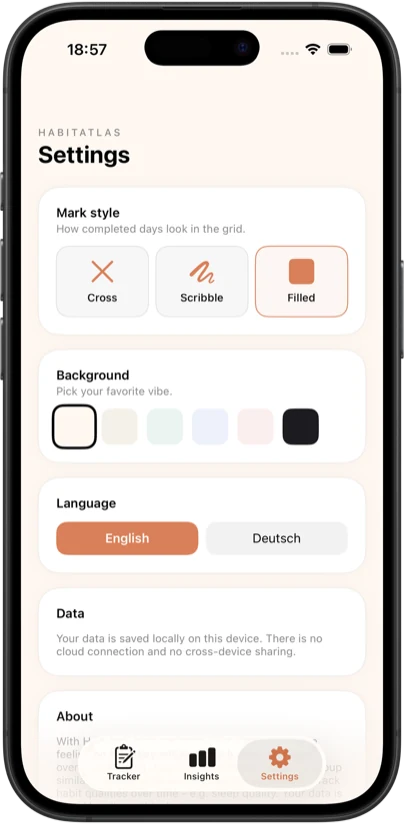
Current app screens with the habit grid, and two insights dashboards, shown across app screens.
The Launch & What I Learned
After about three months of beta testing, HabitAtlas is live on the App Store. The most valuable part for me wasn't the app itself, but going through the full cycle once: concept, design, development and testing, and then everything a real release involves, from App Store screenshots and the store listing to privacy details and App Review. I learned more in this last stretch than I expected.
You can download it here: HabitAtlas on the App Store.
- Learning #1
Paper first saves code later
Two weeks with a hand-drawn grid showed I only needed a yes/no and a quality scale, so duration and frequency tracking were cut before I wrote any code.
- Learning #2
Friction decides whether data exists
Extra gestures were why I stopped logging in other trackers, so every action in HabitAtlas is a single tap. Incomplete data makes even the best insights useless.
- Learning #3
Releasing is a project of its own
Store screenshots, the listing, privacy details and App Review took real time. They are worth planning from the start, not after the app is done.
Privacy Policy
Last updated: 27 October 2026
HabitAtlas stores all your habit data locally on your device. No account is needed.
- No personal information is collected, transmitted or shared. The app contains no third-party analytics, advertising or tracking.
- Your data lives in the app’s storage on your device and is removed when you delete the app. It may be included in your own device backups (for example iCloud or a computer backup), which you and Apple control.
- If you export a month as an image, the image only leaves the app when you choose to share or save it.
- If a future update adds cloud synchronization or any other data handling, this policy will be updated first.
Questions? Contact me via the contact link on this website.
© 2026 Victoria Zeillinger · Impressum