Context and Scope
In a small, flat, cross-functional team, we took an automated clinical decision support tool from initial concept toward formal clinical validation. It analyzes raw blood lab reports and gives clinicians real-time diagnostic insights. Engineering, design, and medical research overlapped daily, and we worked as equal partners on the product. The tool is in development and clinical testing, aiming for regulatory certification as a medical device in Europe (MDR). It is not yet public and is under NDA, so this page is a summary that contains no sensitive or proprietary information.
The Problem
Clinicians face high volumes of lab data, high cognitive load, and the risk of delayed oversight. The challenge was twofold:
- Data ingestion: turning vast, unstructured medical literature and disease criteria into an accurate, algorithm-ready database.
- Interface: designing a dual-sided interface (clinicians and administrators) that stays clean and effortless without the back-and-forth prompting of typical AI chatbots, and integrates into existing clinical workflows via API or a secure standalone web app.
My Contributions & Collaboration
In a small team with no silos, my work spanned the full product lifecycle:
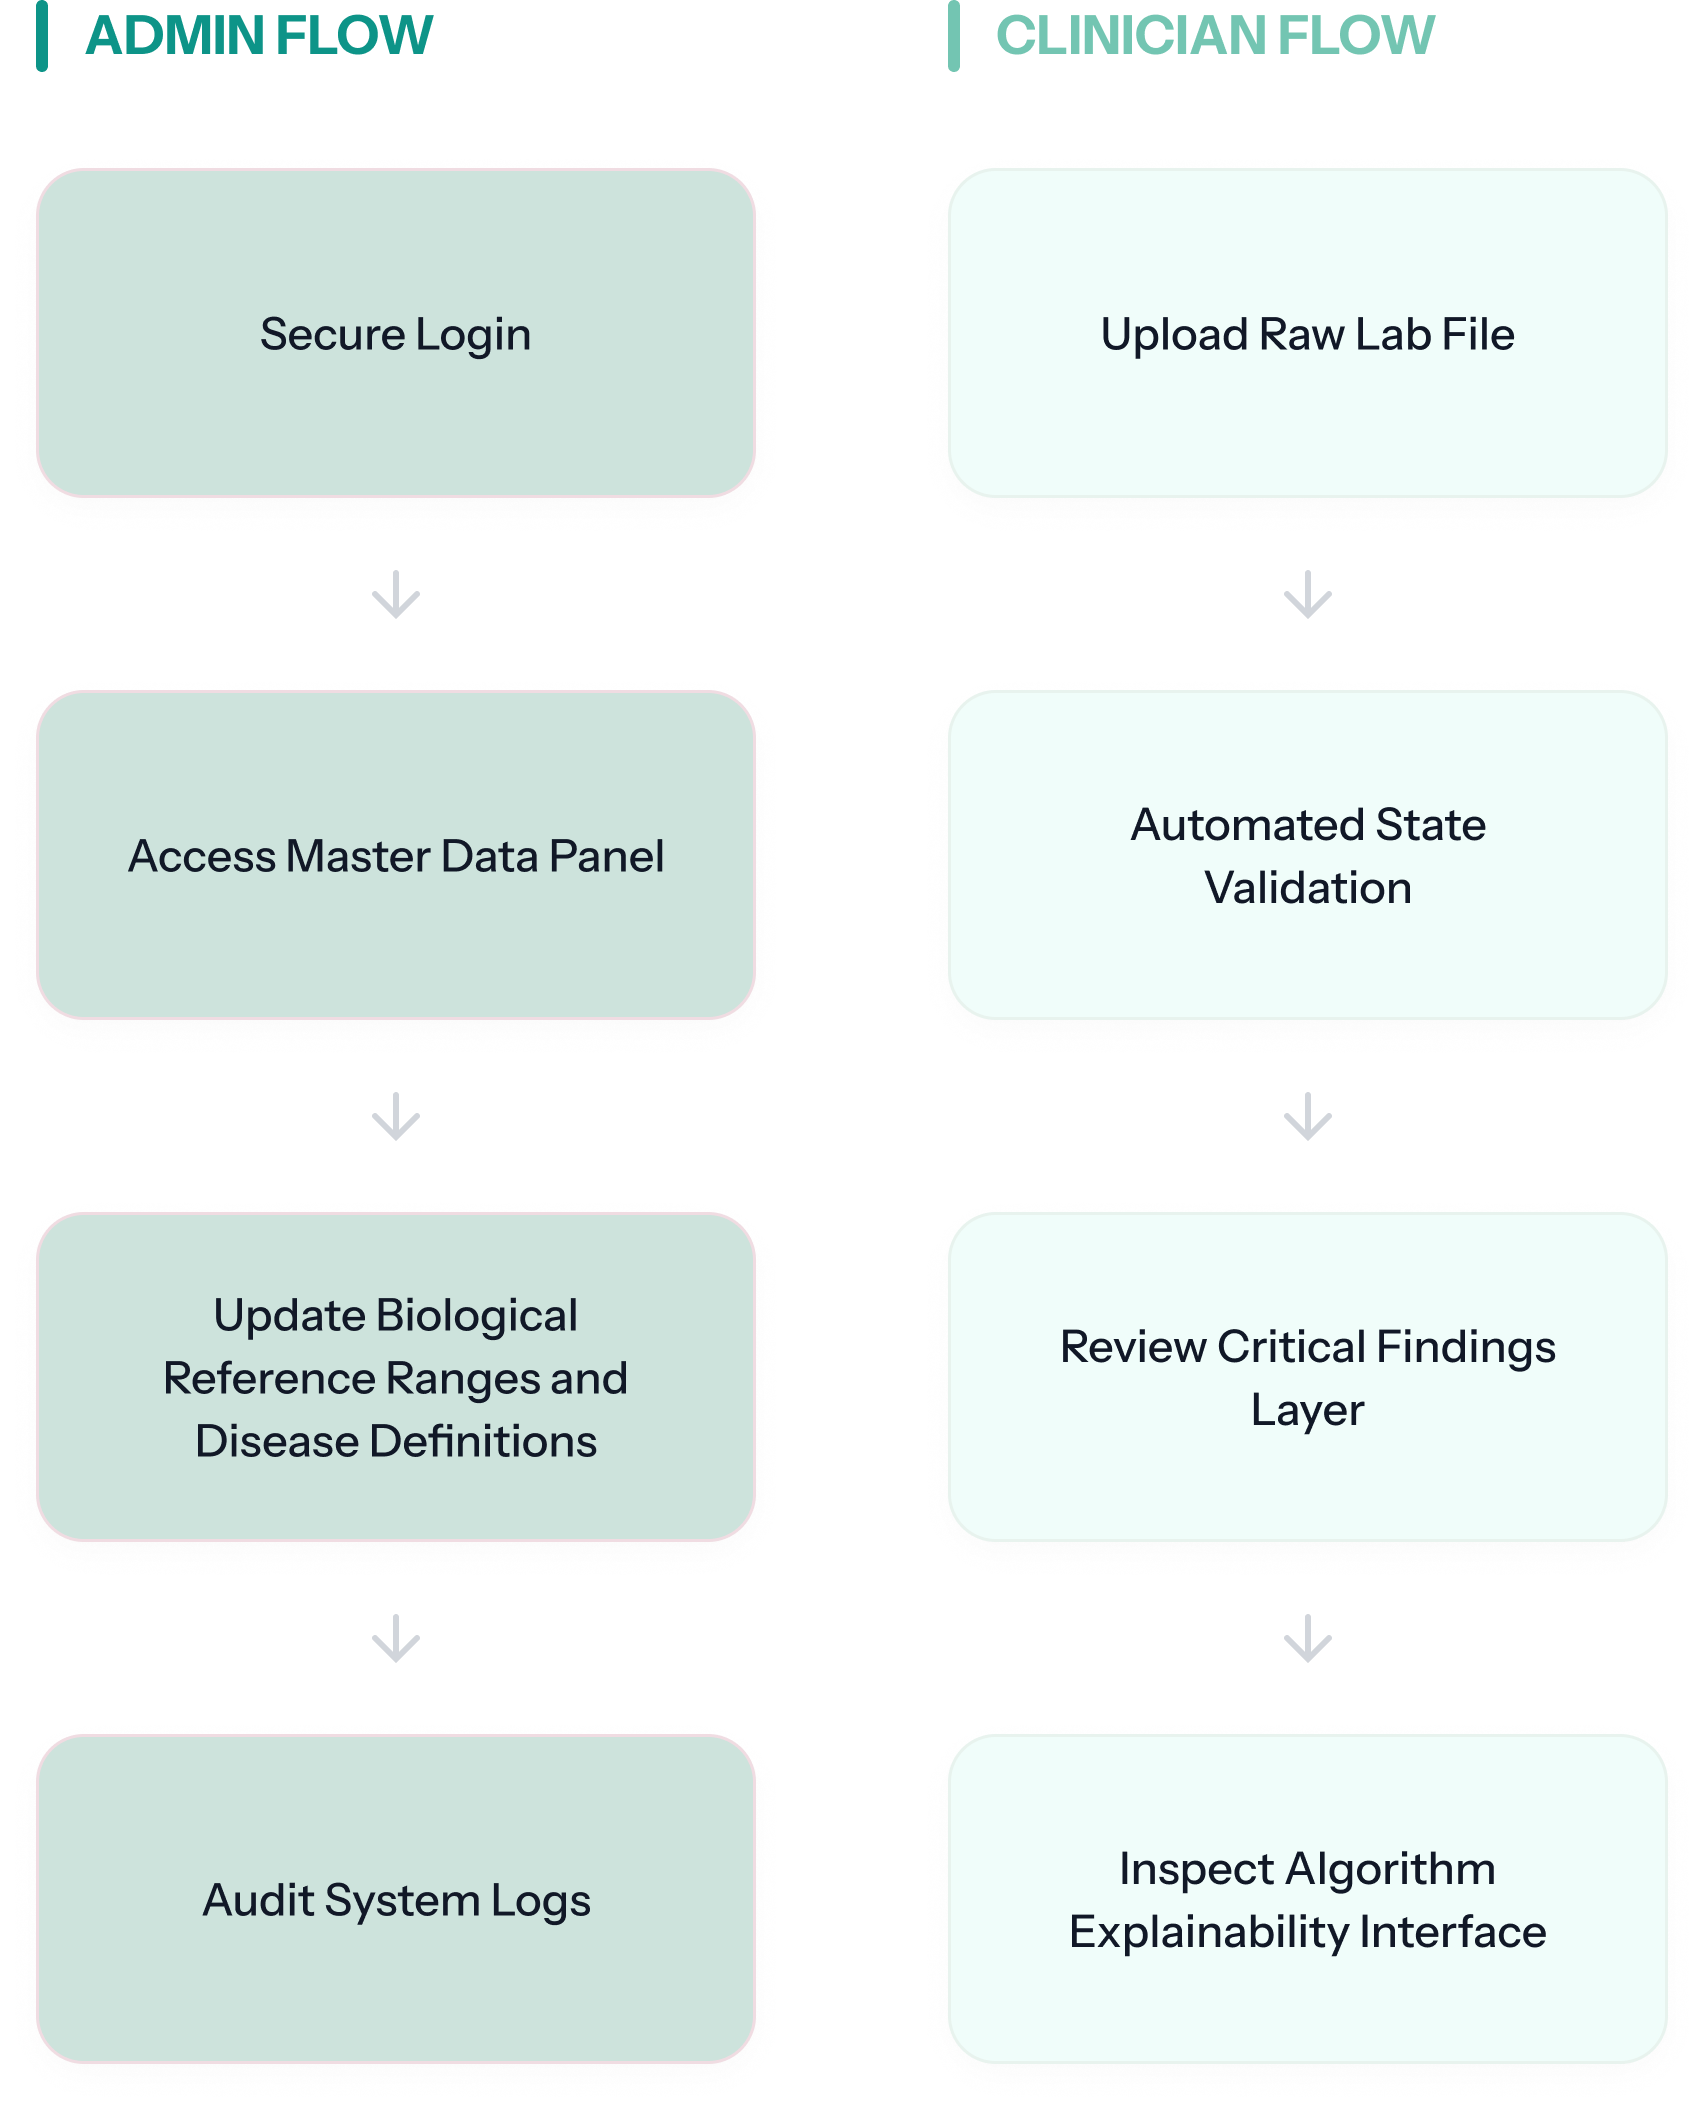
User flow mapping the clinician and administrator journeys.
- Dual user flows: mapped the journeys for both the clinician (interpreting lab findings) and the administrator (managing reference ranges and master data).
- Feature pruning: worked with the team to define the MVP, prioritizing essential features and cutting UI that made the screens feel cluttered and wasn't essential.
- Usability & QA testing (with a colleague): ran ongoing usability loops together with our developer to catch UX bottlenecks and triage bugs.
- Technical research (with a colleague): together we evaluated analysis algorithms and frontend libraries to handle heavy, real-time data grids responsively.
- Redesign of the two-role application: co-designed with my colleague the ranking by match score and the explainable suggestions. The HL7 import was my concept and my redesign, as were the match-score tooltip, the missing-value highlight and the related-findings tooltips on the follow-up tests (details below).
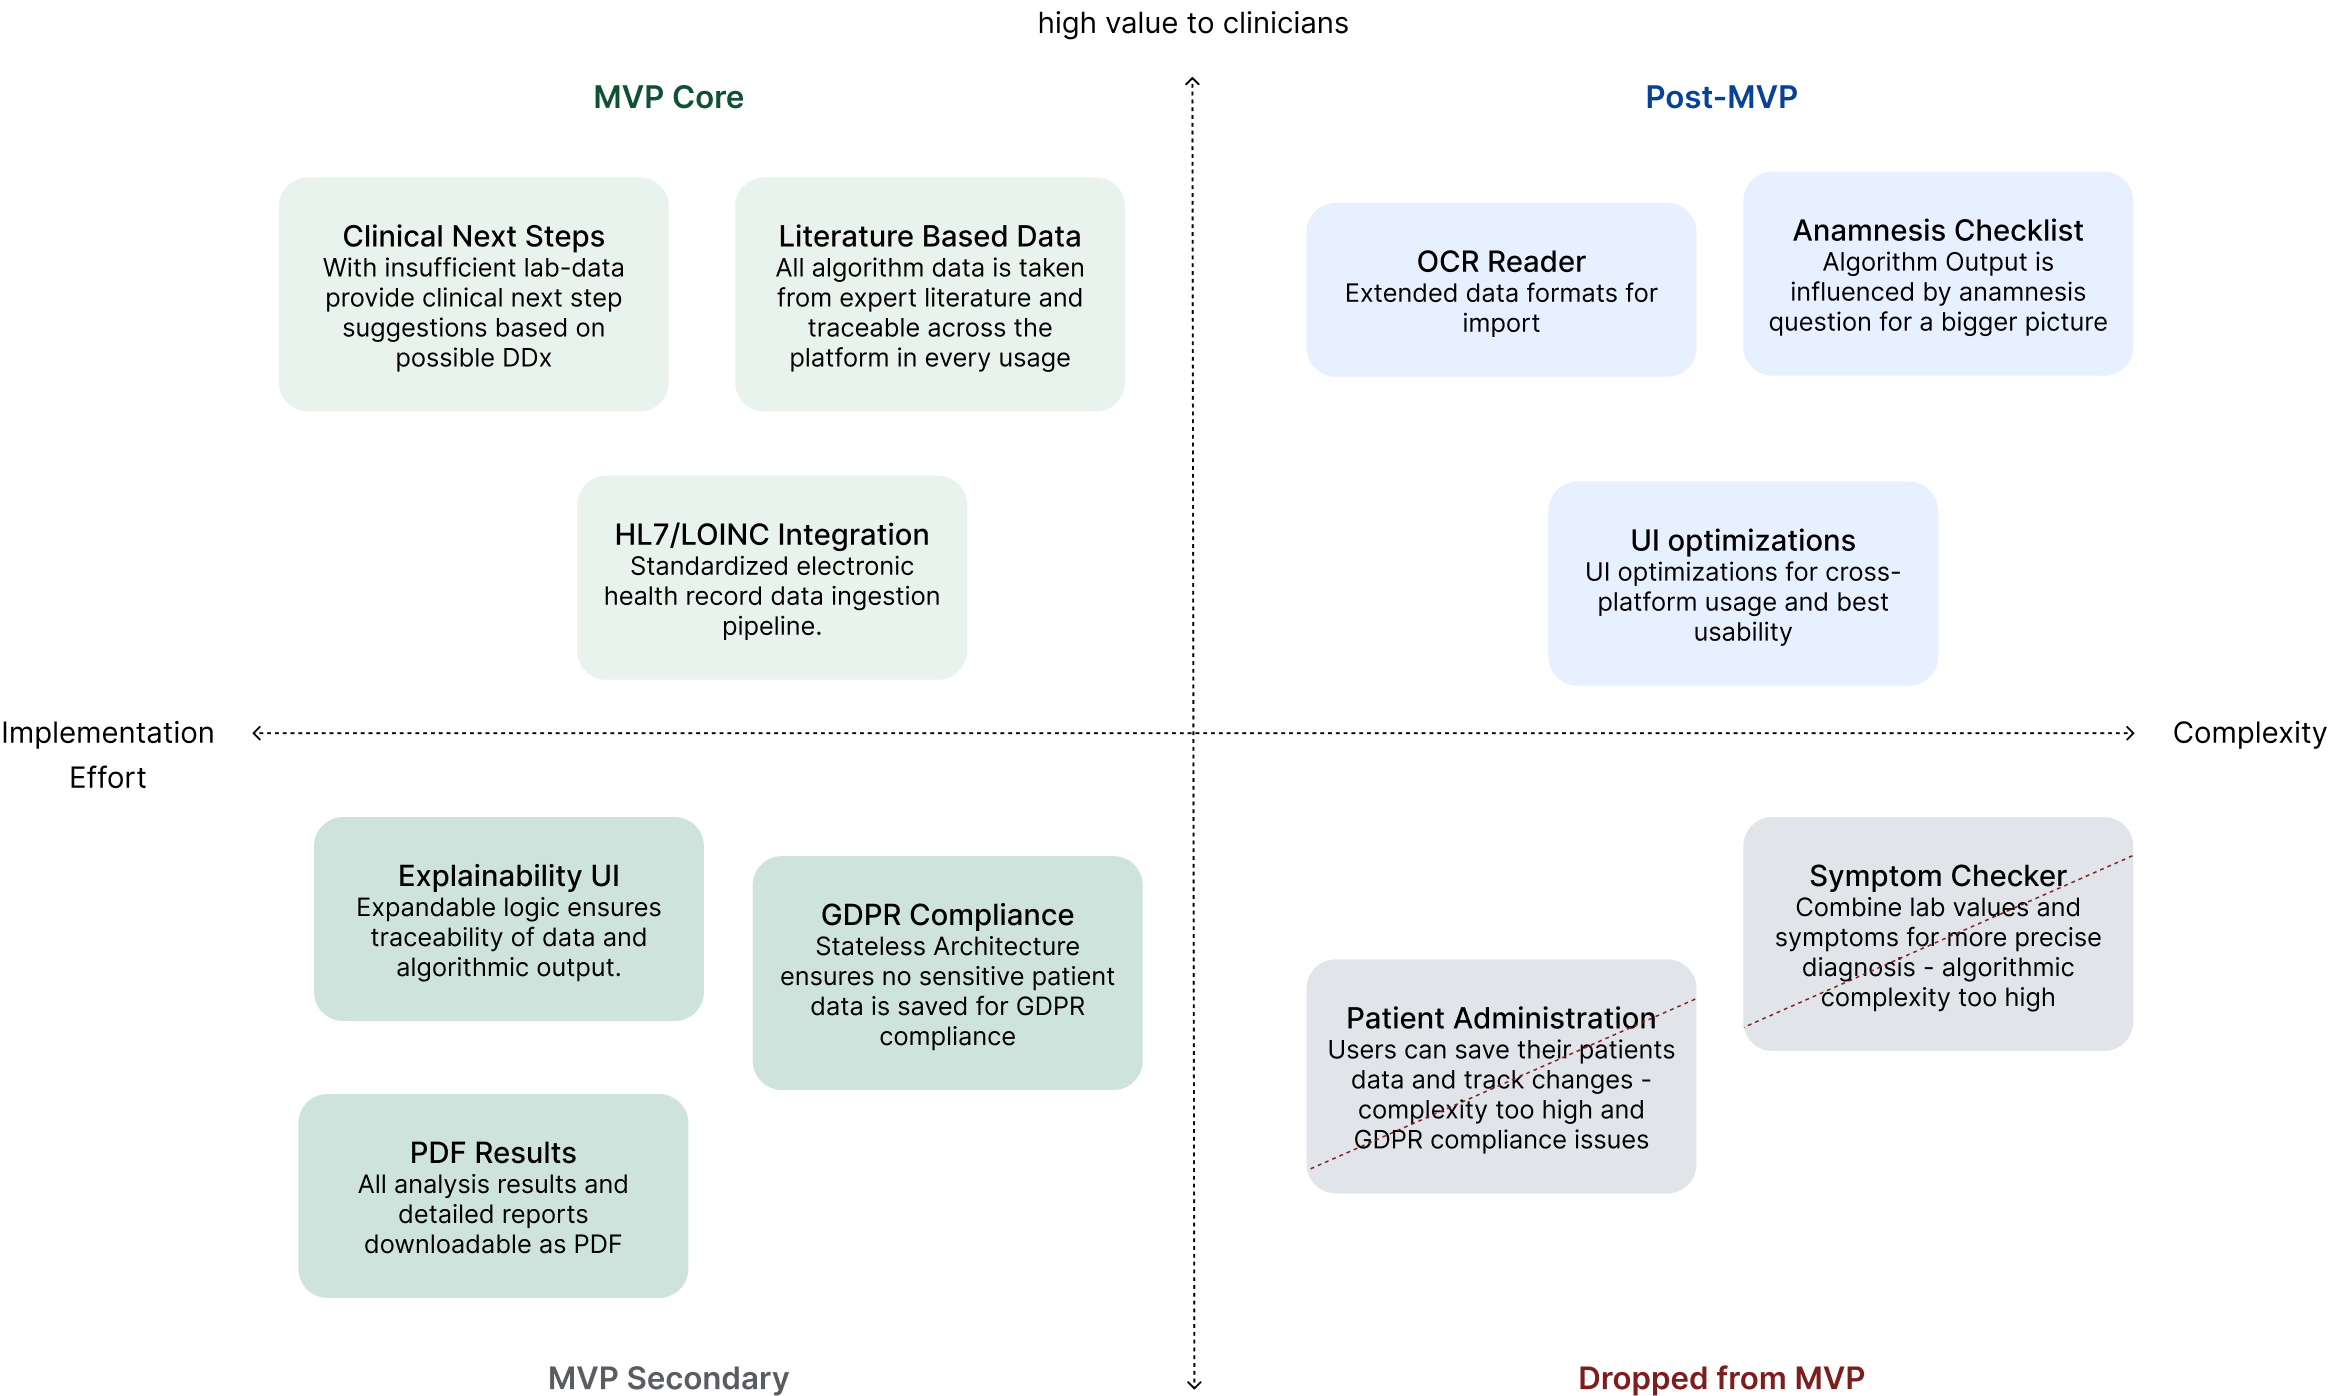
Feature matrix used to prioritize and scope the MVP.
- Literature database: the medical research and data entry to translate disease criteria and lab parameters into a structured, algorithm-ready clinical database.
- Scoring algorithm: reworked the matching algorithm three times together with my colleague, so the score reflects how well a patient's values fit each disease definition.
- Evaluation: evaluated the algorithm against 250+ historical patient cases before it moved toward clinical trials.
Key Design Decisions
Screens recreated with demo data in a new visual style; the production interface is under NDA.
Co-designed with my colleague; the info tooltip is my design.
The first version listed suggested diseases alphabetically, so the most relevant finding could sit at the bottom. Together with my colleague, I reworked the list to rank findings by how well the patient's values match each disease definition, using a scoring system we worked out together.
The calculated score is shown as a bar that is full when every defining criterion is met. Before, the tool showed only the absolute number of matching values. That said little, because each disease needs a different number of criteria: 3 matches can be everything for one disease and a weak signal for another.
My addition: an info icon next to the match score that opens a tooltip explaining what the score means, so clinicians can read the bar correctly without prior training.
Feedback from clinical review showed that once doctors suspect a disease, they want to see why it is ranked where it is. That led to the next decision.
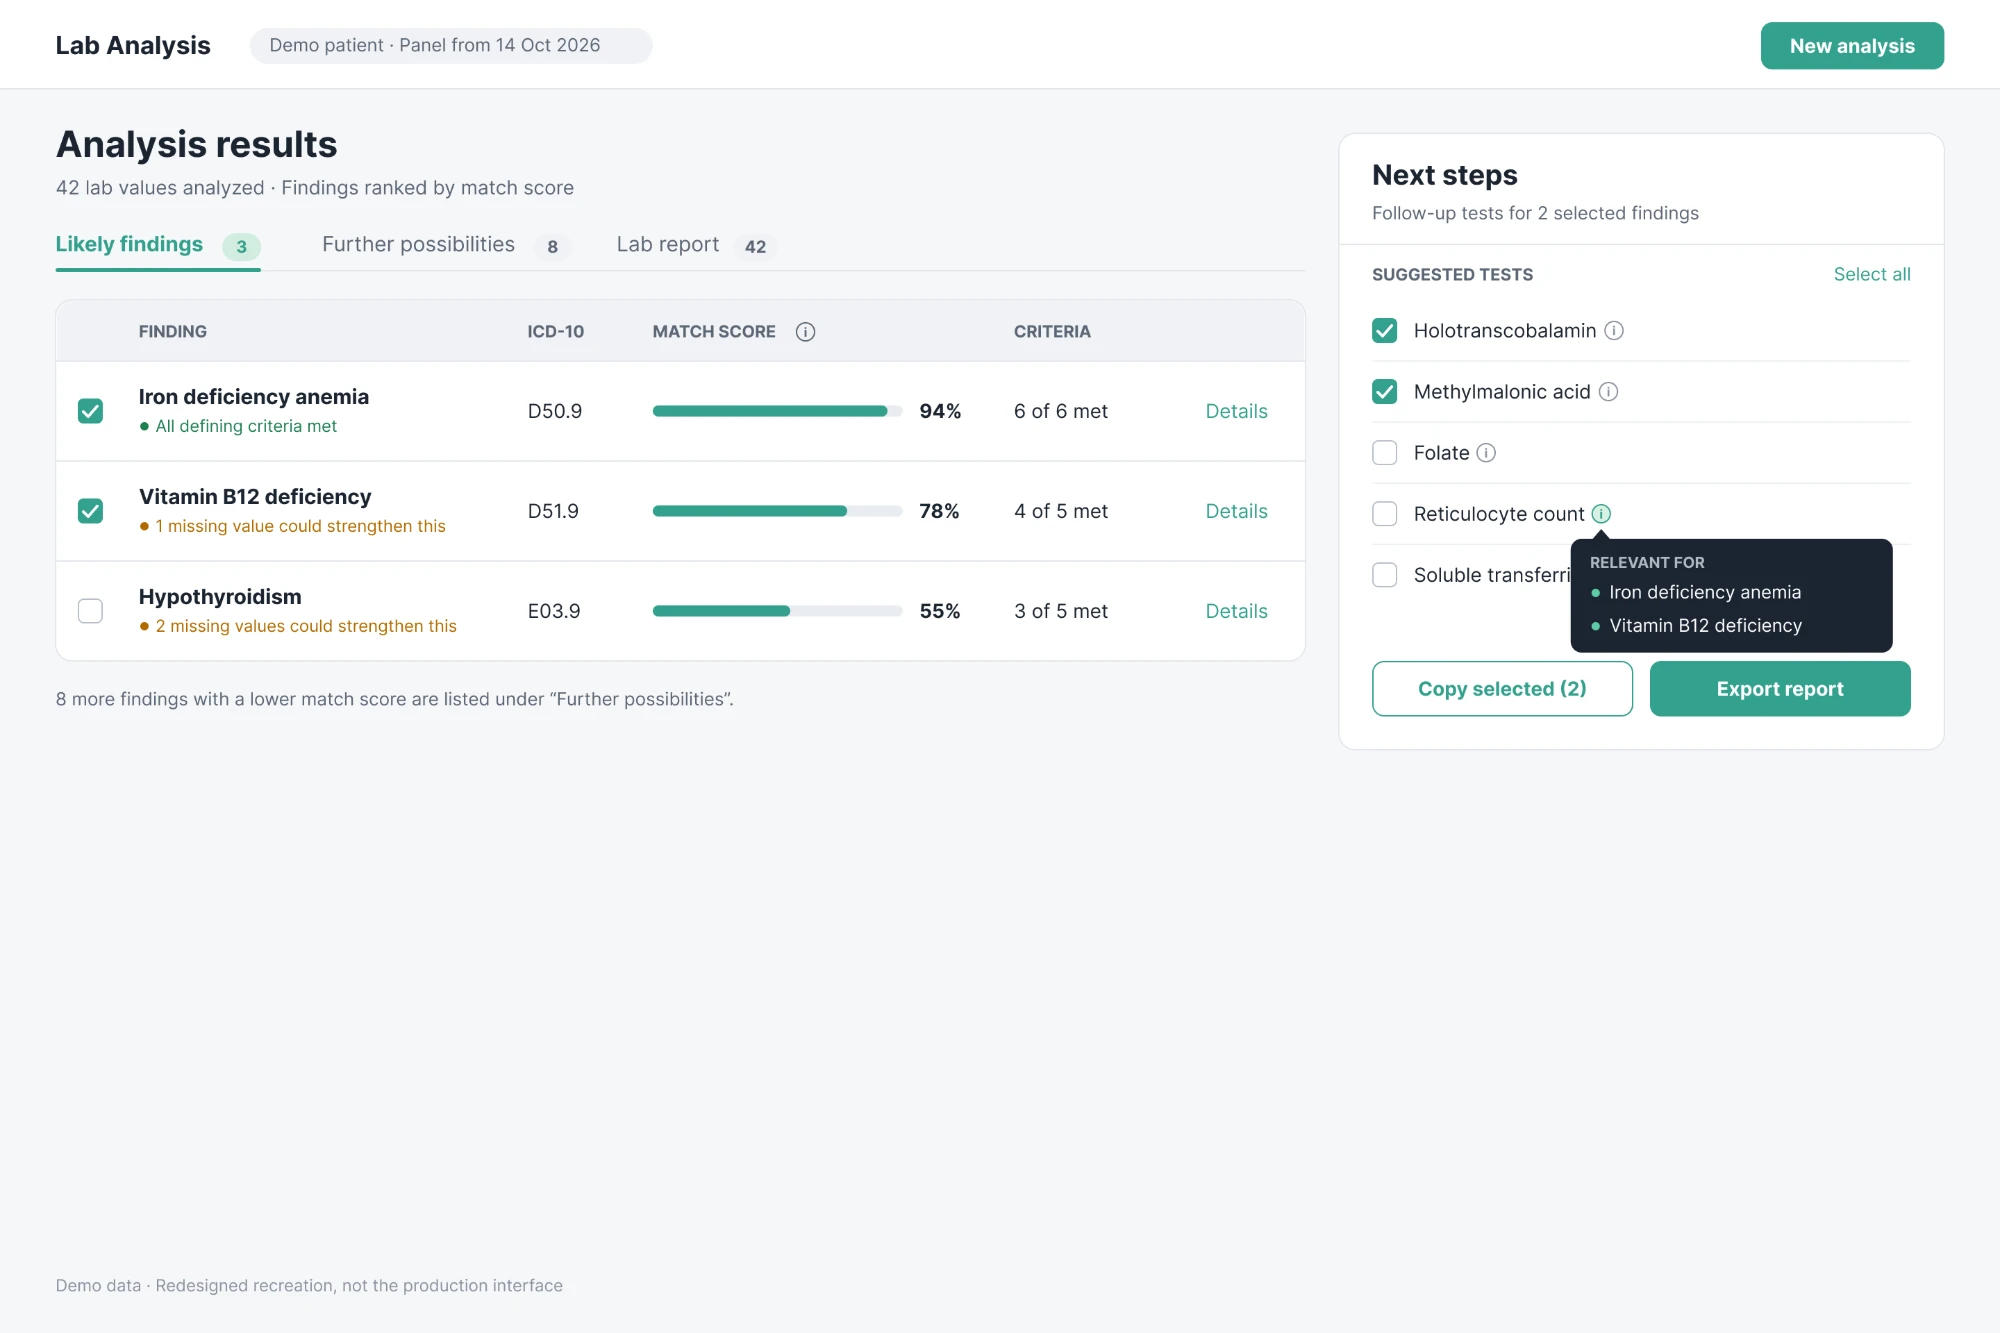
Redesigned results view (new visual style, demo data): findings ranked by match score, with the Next steps panel and its related-findings tooltip.
Co-designed with my colleague; the missing-value highlight is my design.
Together we designed the finding details: opening a finding shows every lab value in its definition next to the patient's actual result and the sending lab's reference range. Clinicians can check the reasoning instead of trusting a number.
On my own, I designed a highlight for values that are part of the definition but weren't measured. Measuring them could confirm or rule out the finding, so they feed directly into the next steps. This highlight is designed but not yet implemented.
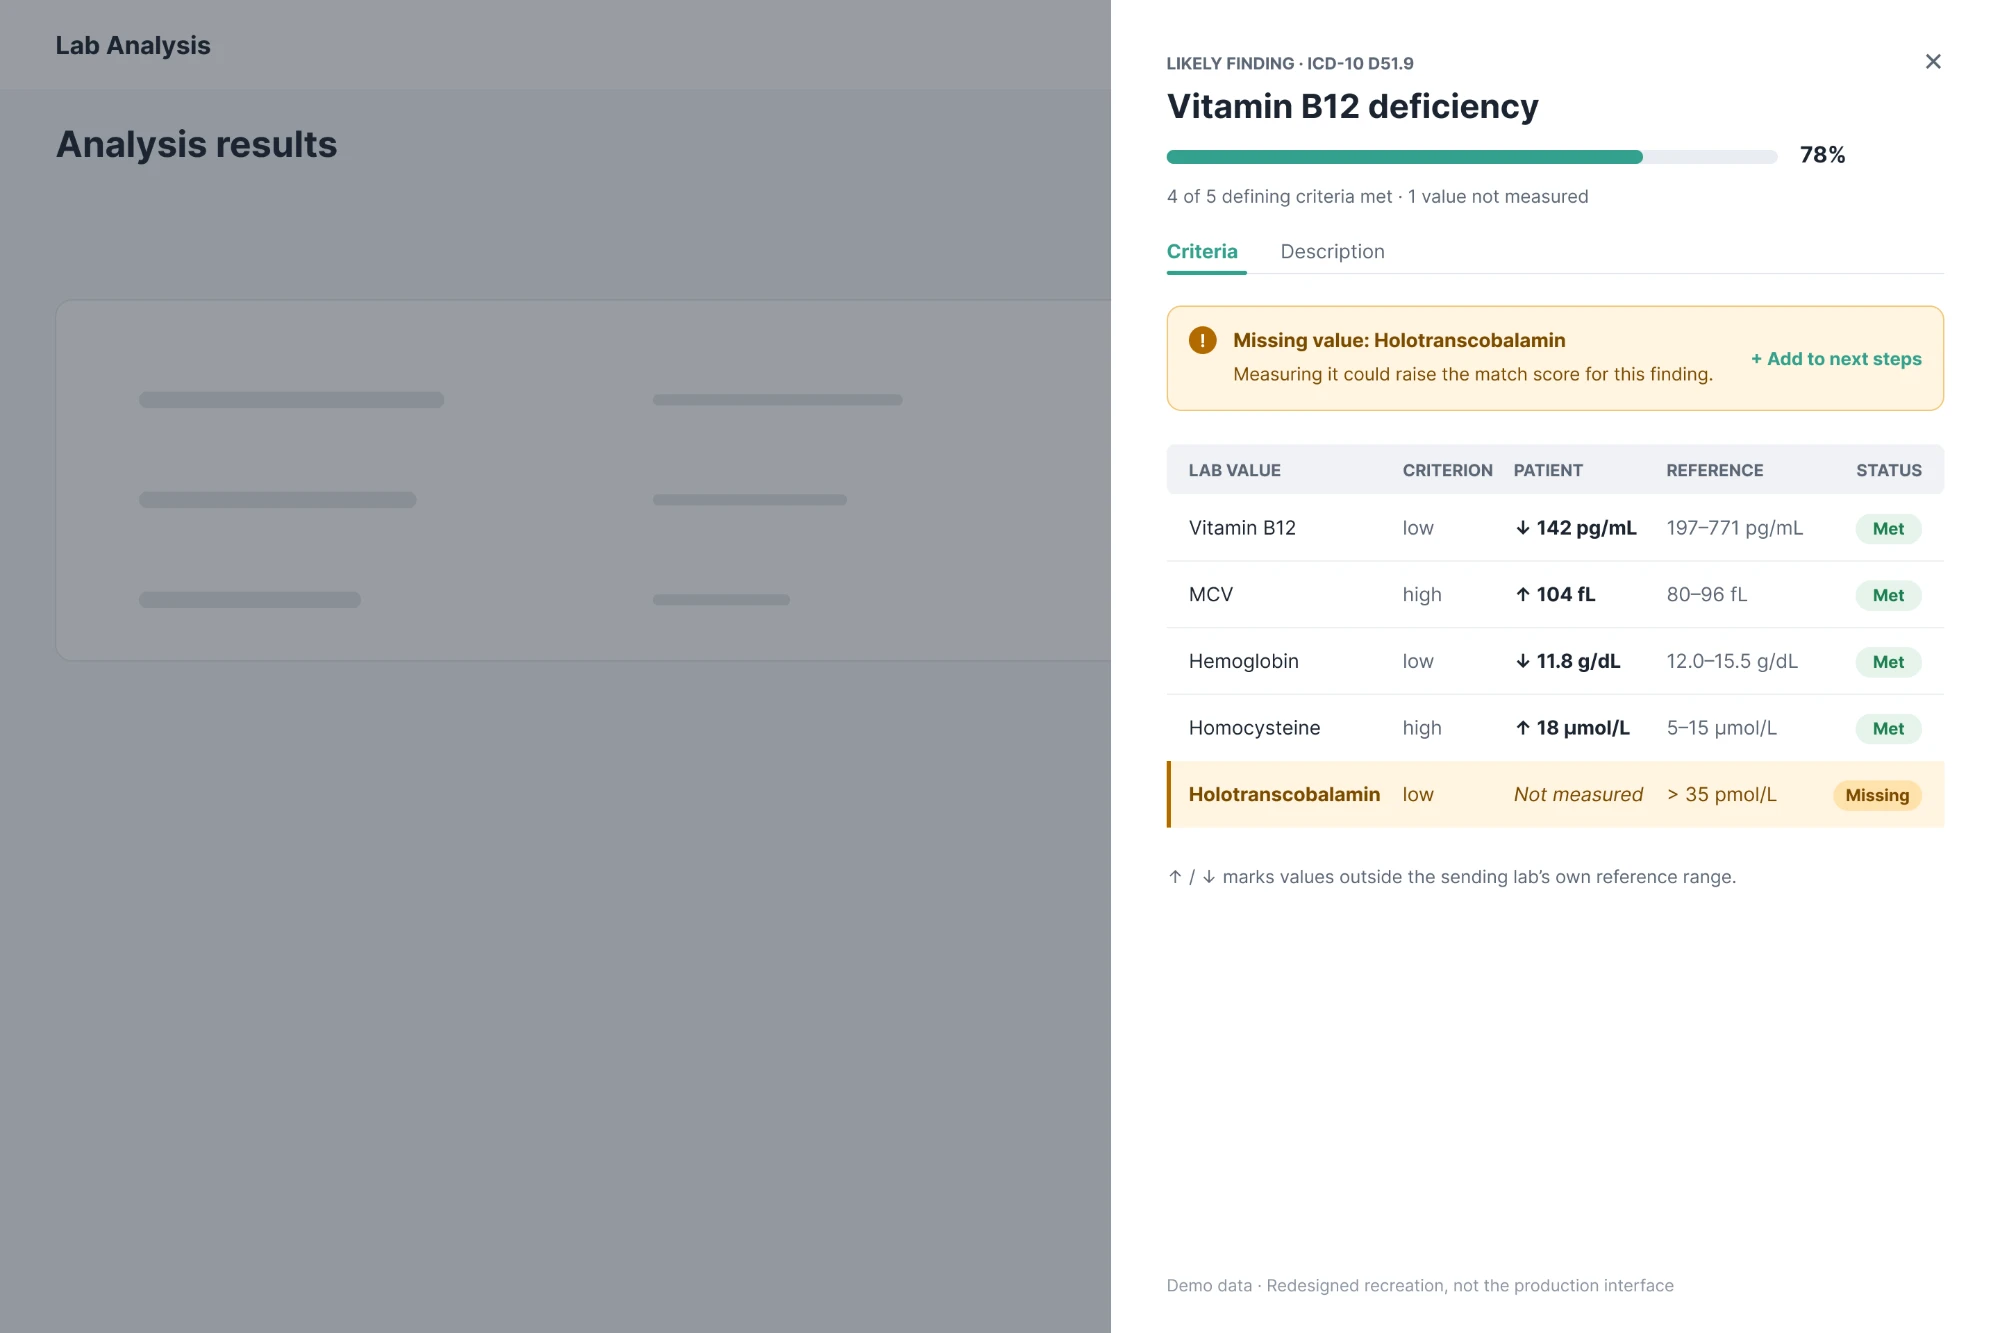
Finding details (new visual style, demo data). The missing-value highlight is designed but not yet built.
My idea, concept and design.
Early versions needed every lab value typed into a table by hand. A typical report has 20–50 values, and even admin users who knew the tool well needed 20–25 minutes per report to enter them with the correct reference ranges. That was slow and error-prone, and it made reference ranges inconsistent, since every lab uses its own. HL7 is the standard format labs in Europe already send, so I decided the tool should take HL7 files as its only input.
The system now reads names, values, LOINC codes and each lab's own reference ranges automatically. It maps values to our database by LOINC code. Anything it can't match goes to a short review step before the analysis, where the user maps or skips it. On average only 1–3 values need mapping, one click each. Entering a report went from 20–25 minutes to a drag and drop and under 3 minutes.
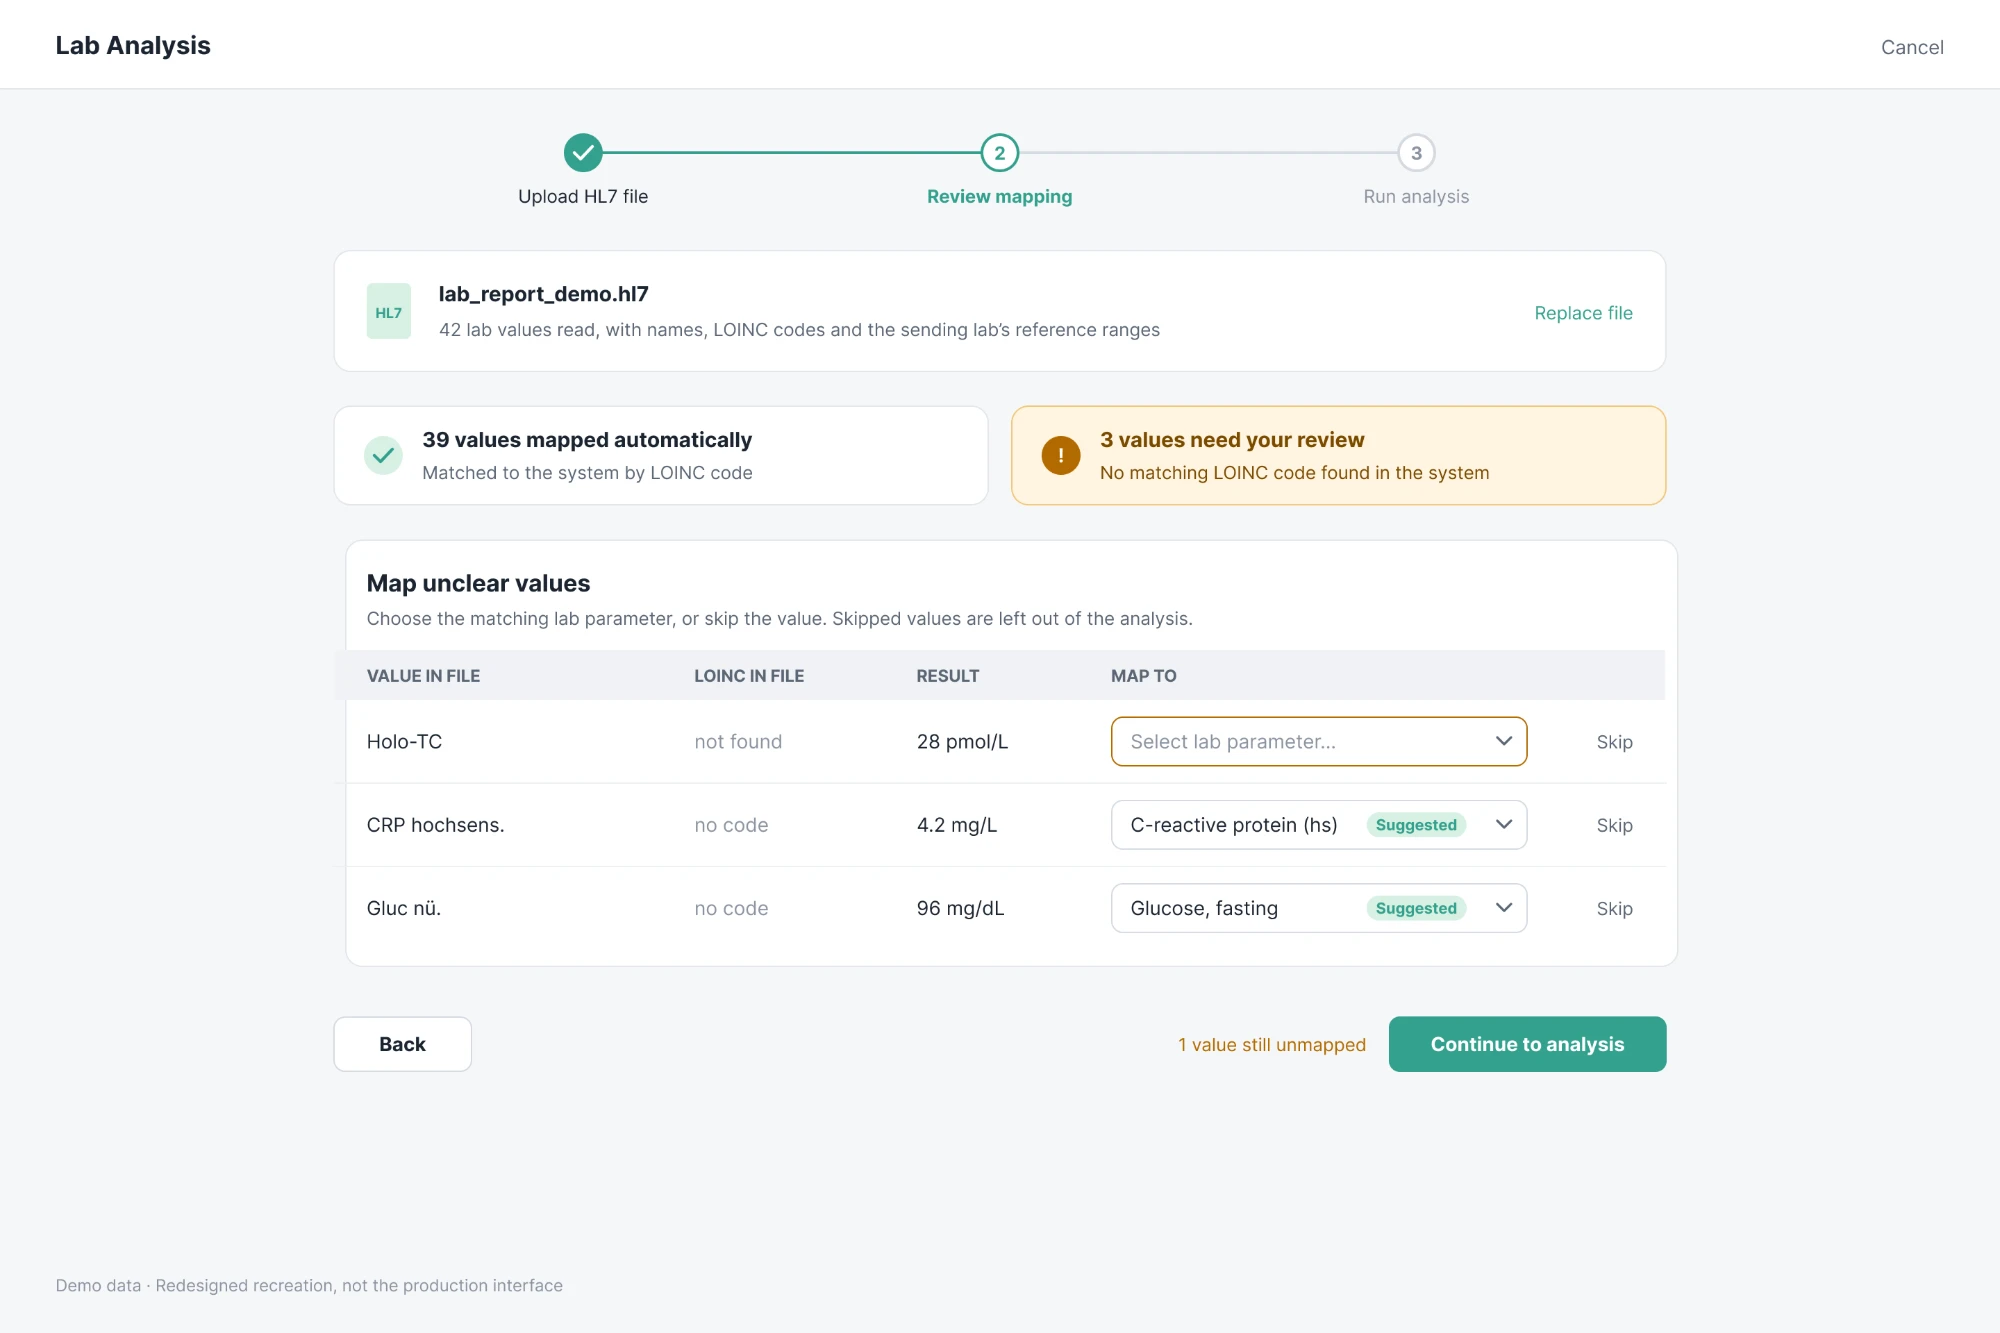
HL7 import with the mapping review step (new visual style, demo data).
The Next steps panel was part of our founder's original concept, and they gave a rough layout for it. It lists follow-up tests for the findings a clinician selects. But a list of test names alone doesn't say which suspicion each test helps clarify.
My addition: an info icon next to every test that opens a tooltip listing the findings it relates to, so clinicians see at once why a test is there. I also added Select all, so the whole list can be copied in one step. You can see both in the results screen of point 1.
The Product Workflow Breakdown
Stage 1 · Input & Data Masking
Blood lab data in HL7 format is ingested into an anonymous, highly structured data grid. The tool runs a stateless architecture to ensure absolute data privacy, mapping specific biomarkers against exact biological reference ranges of definitions based on expert literature.
Stage 2 · Frontend Processing & Logic Loop
The user interface utilizes an optimized state-management architecture to handle complex data states. Custom data-fetching mechanisms feed the clinical validation engine locally, ensuring that filtering, sorting, and state transitions happen instantaneously without UI lag.
Stage 3 · Output & Explainability UI
The final clinician dashboard prioritizes data hierarchically. Likely findings display suggestions with the greatest overlap in underlying literature first. Any further suggestions are shown as additions with possible next diagnostic steps. All algorithmic influences from literature can be explained and traced exactly via the traceability interface.
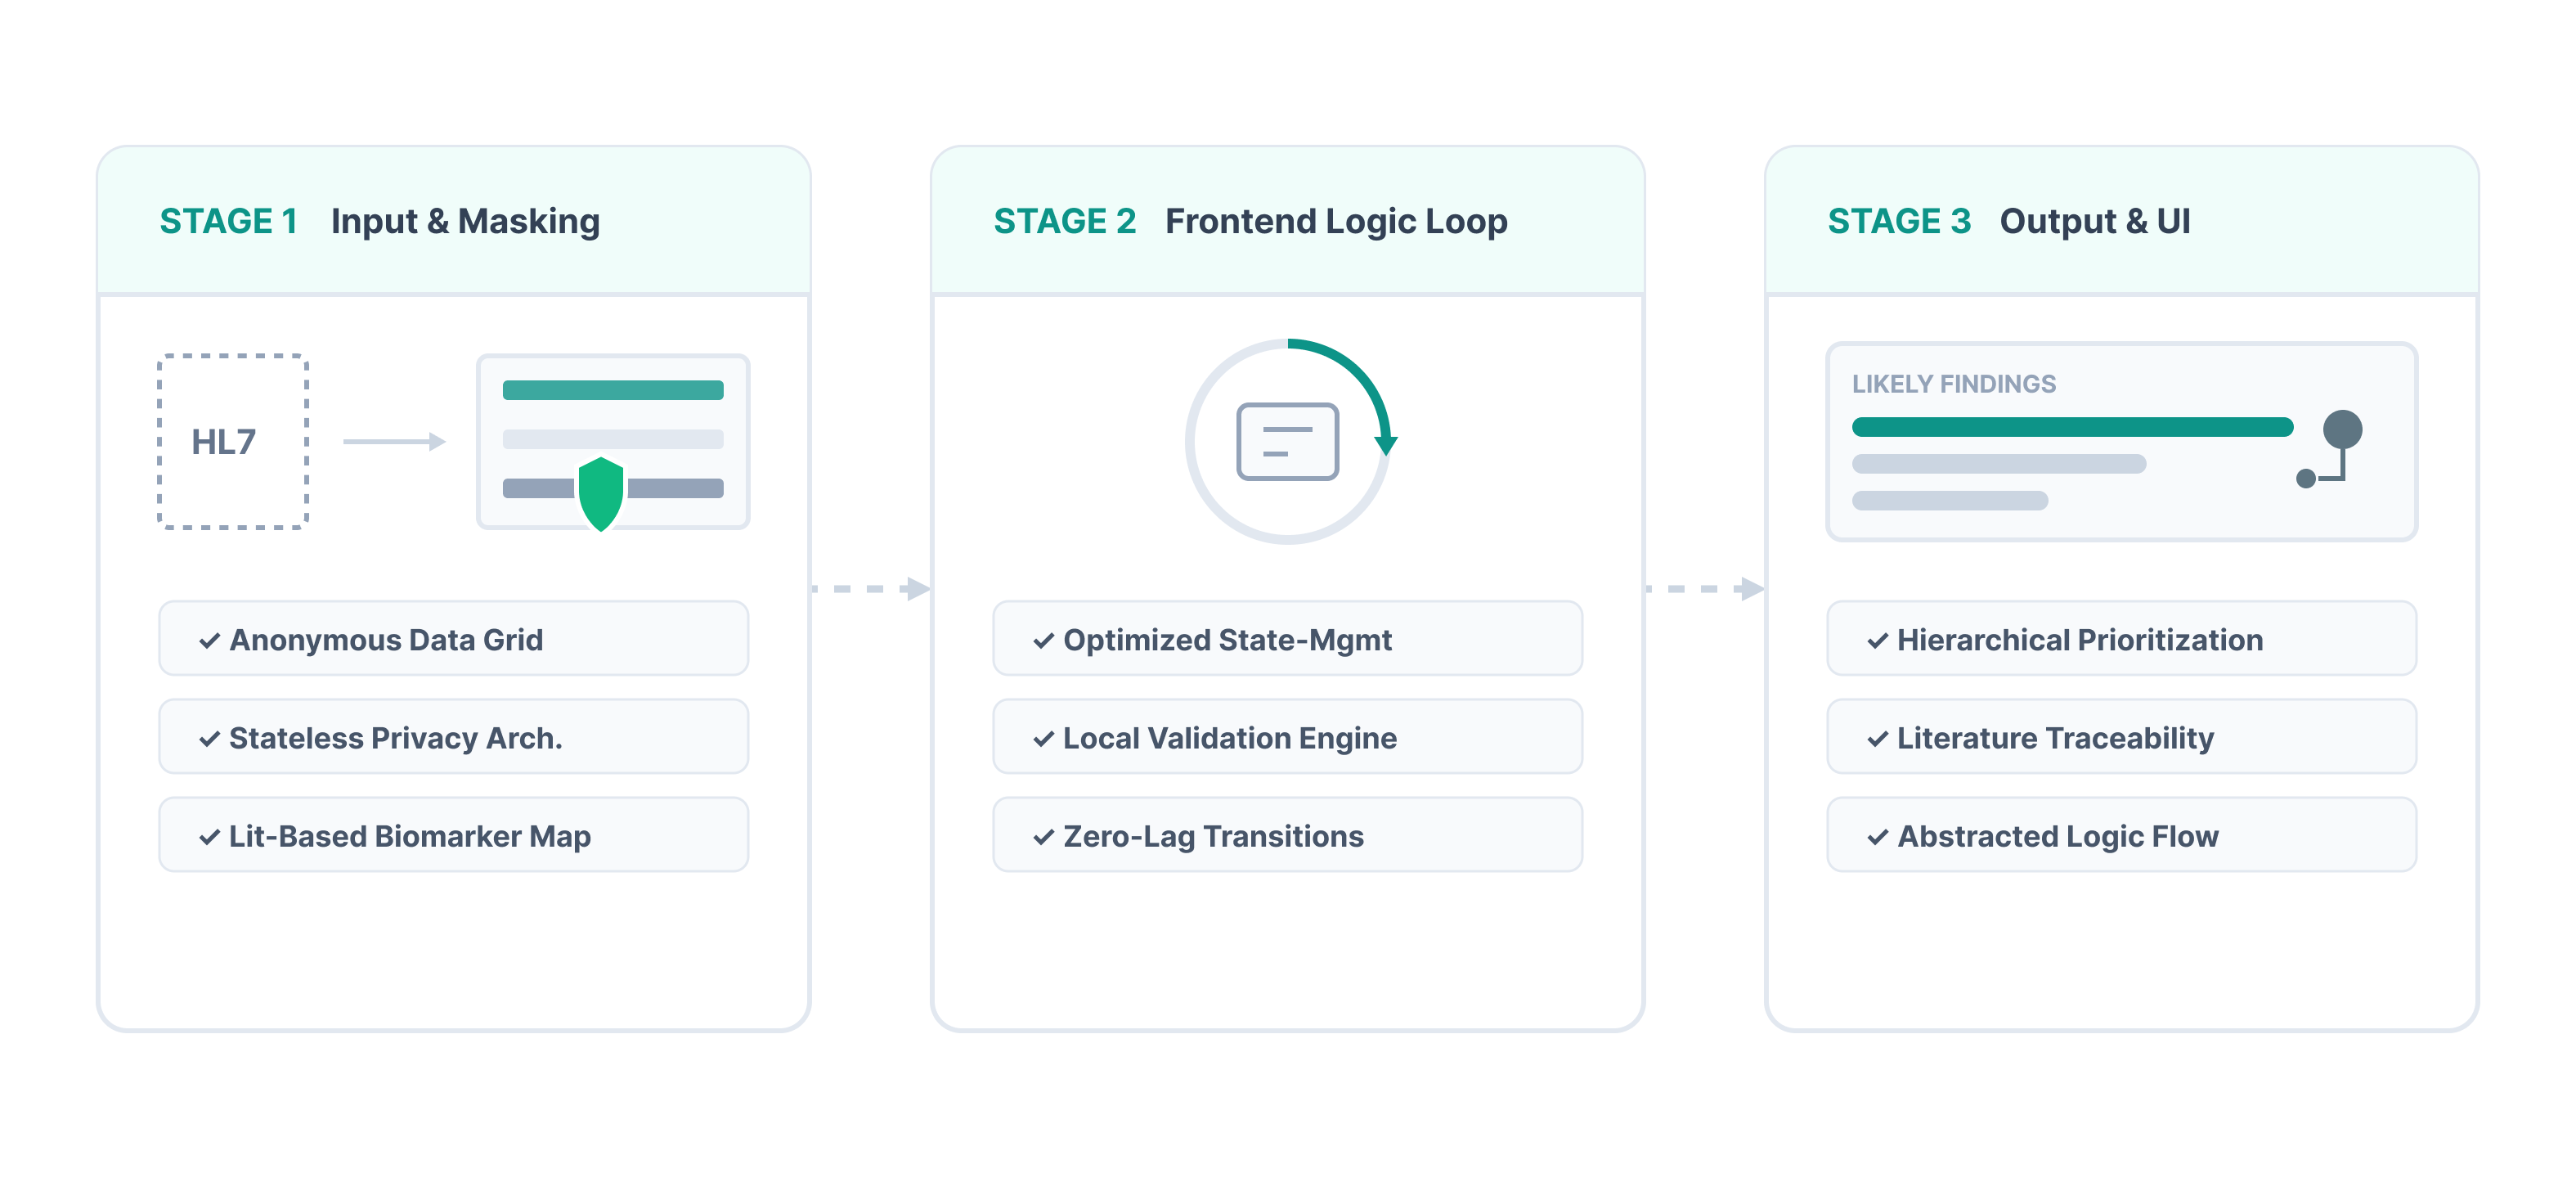
End-to-end workflow, from data ingestion to the clinician-facing explainability UI.
Clinical Validation & Regulatory Readiness
As the project moves toward MDR certification, I am co-authoring the clinical study designs, evaluating statistical methodologies, and preparing formal proposals for the upcoming trials.
Current Impact & Next Steps
The tool has progressed from a research concept to a stable, production-ready system. Clinical trials for regulatory certification come with their own requirements, so we are now adapting it for that phase before testing begins.
© 2026 Victoria Zeillinger · Impressum